
Automated Reporting Explained for Decision-Makers
Automated Reporting Explained for Decision-Makers
Automated reporting is the process of connecting your data sources, transforming that data, and distributing finished reports to stakeholders on a schedule or in real time, without anyone manually pulling numbers or building slides. The business impact is direct: your team stops spending Tuesday mornings rebuilding last week’s dashboard and starts spending that time on the decisions the dashboard reveals. If you’re evaluating whether to automate your reporting, the fastest first step is a simple audit: list every recurring report your team produces, who builds it, and how long it takes. That list alone usually makes the case.
Table of Contents
- What is automated reporting, and how does it differ from manual work?
- How does automated reporting work? The core pipeline
- What types of automated reports do teams actually use?
- What are the real benefits of automated reporting?
- What capabilities does a reliable automated reporting system need?
- How do you implement automated reporting? A step-by-step checklist
- What challenges should you expect, and how do you solve them?
- What does implementation cost, and when do you see ROI?
- How do you keep automated reports accurate over time?
- What does the evidence say about automated reporting’s impact?
- Key Takeaways
- The part most teams get wrong about automation
- Botiqueai builds the pipelines so your team can focus on the decisions
- Useful sources
What is automated reporting, and how does it differ from manual work?
Automated reporting replaces the manual cycle of exporting CSVs, pasting data into spreadsheets, formatting charts, and emailing PDFs. Instead, a reporting system connects directly to source systems and refreshes dashboards or generates documents on a defined schedule or trigger.
The practical difference shows up in three failure points that plague manual processes:
- Copy/paste errors. A single transposed figure in a weekly sales summary can send a team chasing a problem that does not exist.
- Versioning disputes. When finance runs its own export and operations runs another, the numbers rarely match. Meetings stall on reconciliation instead of decisions.
- Delays. A report that takes four hours to build on Friday afternoon arrives too late to influence Monday’s call.
Automated systems enforce consistent logic across every run. The same query, the same transformation, the same output, every time.
| Dimension | Manual reporting | Automated reporting |
|---|---|---|
| Data freshness | Hours to days after period close | Scheduled or near real-time |
| Error risk | High (human transcription, formula breaks) | Low (consistent logic, validated pipelines) |
| Scalability | Degrades as report count grows | Scales without proportional effort |
| Analyst time | Mostly production work | Mostly interpretation and QA |
| Best fit | Ad hoc, one-off analysis | Recurring, stakeholder-distributed reports |
Manual reporting still has a place for exploratory analysis or one-time requests where building a pipeline would cost more than the report is worth. For anything recurring, automation wins on every dimension above.
How does automated reporting work? The core pipeline
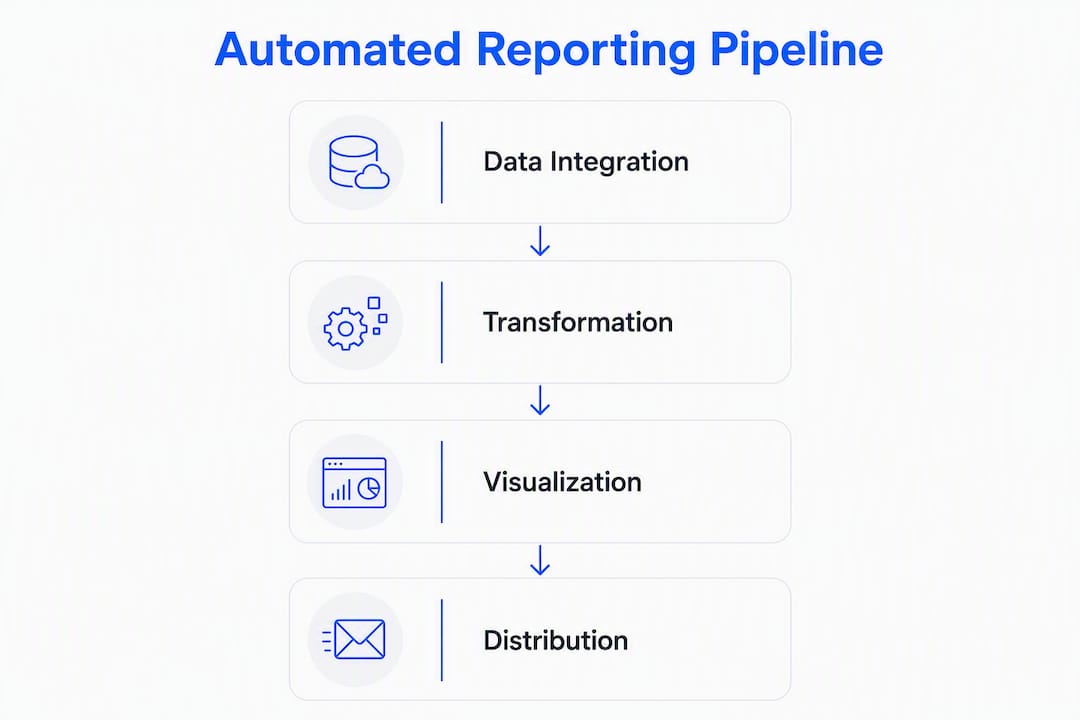
Every automated reporting system, regardless of vendor or complexity, runs the same four-layer pipeline.
Data integration. Connectors pull data from source systems: your CRM, ERP, marketing platform, database, or cloud storage. These connectors use APIs, direct database queries, or ETL/ELT tools like Fivetran, dbt, or Apache Airflow to move raw data into a central location, typically a data warehouse such as Snowflake, BigQuery, or Redshift.

Transformation. Raw data is rarely report-ready. A transformation layer cleans, joins, and aggregates it: converting timestamps to fiscal periods, calculating margins, deduplicating records. This is where business logic lives, and it is the layer most often underestimated during scoping.
Visualization. Transformed data feeds into a reporting layer: a BI tool like Microsoft Power BI or Tableau, a custom dashboard, or a document template that renders as PDF. Templates define layout, branding, and which metrics appear where.
Distribution. Finished reports are pushed to recipients via email, a shared dashboard link, a Slack or Teams message, or an API endpoint. Scheduling logic controls when each report runs; alert rules trigger delivery when a metric crosses a threshold.
A simplified flow looks like this: Source systems → connectors/ETL → data warehouse → transformation/modeling → visualization layer → scheduled distribution to stakeholders. Every tool decision you make maps to one of these four layers.
What types of automated reports do teams actually use?
The format depends on the audience and the decision it supports. Common types include:
- Scheduled summaries. Weekly P&L snapshots, monthly marketing performance digests, or daily operational scorecards delivered by email at a fixed time.
- Real-time dashboards. Live views of inventory levels, pipeline value, or website traffic that stakeholders access on demand. No delivery needed; the data refreshes automatically.
- Threshold alerts. A notification fires when a KPI crosses a defined boundary: gross margin drops below 40%, server error rate spikes, or a campaign’s cost-per-acquisition exceeds budget. These are the reports that enable early intervention.
- Board and executive packs. Formatted PDF or slide-deck outputs generated from a template, combining financial, operational, and strategic metrics for a monthly or quarterly audience.
- Client-facing white-label reports. Agencies and service firms use automated report generation to deliver branded performance summaries to clients without manual assembly.
Three short examples show how these map to real functions:
Finance: A controller sets up a scheduled P&L that pulls from the ERP every Monday at 6 AM, applies the current period’s allocation rules, and emails a formatted PDF to the CFO and department heads before the weekly standup. No analyst touches it.
Marketing: A growth team connects Google Analytics, paid media APIs, and their CRM to a dashboard. Campaign spend, attributed revenue, and CAC update every four hours. The team reviews trends, not exports.
Operations: A distribution company runs an alert that fires when any warehouse’s on-hand inventory for a top-20 SKU falls below a two-day supply threshold. The operations manager gets a Slack message before a stockout occurs, not after.
Automated reporting tools generally fall into three categories: built-in CRM reporting (fast to deploy, limited flexibility), BI platforms (flexible, higher setup cost), and integration/automation connectors (maximum flexibility, highest engineering effort). Matching the tool category to the report type saves significant rework.
What are the real benefits of automated reporting?
The efficiency gains are measurable. Benchmarking across enterprise and finance implementations shows automated reporting reduces time spent producing recurring reports by 40–70% and lowers related process costs by 35–46%. For a team spending 20 hours a week on report production, that is several hours recovered every week.
Automated reporting reduces report production time by 40–70% and process costs by 35–46%. These are the benchmarks enterprise and finance teams consistently hit after automating recurring reports.
But the efficiency number understates the strategic value. The real shift is what leadership does with recovered time. When analysts stop rebuilding dashboards, they start interpreting trends, modeling scenarios, and flagging risks. Finance leaders stop defending their version of the numbers and start discussing what the numbers mean.
Typical teams save 10–20 hours per week once dashboards replace repeated manual builds, and the benefit compounds as the number of stakeholders and report types grows. A single automated pipeline can serve ten recipients as easily as one.
Near real-time data access is a separate benefit category. Access to live dashboards enables earlier interventions on margin compression, cash-flow pressure, or campaign underperformance. The difference between catching a problem on day three versus day twelve of a month is often the difference between a manageable correction and a missed quarter.

Accuracy is the third pillar. Manual reporting is prone to copy/paste mistakes, broken formulas, and versioning disputes. Automated systems apply the same logic every run and produce an audit trail, which matters significantly in regulated industries where traceability is a compliance requirement.
What capabilities does a reliable automated reporting system need?
Decision-makers evaluating tools or vendors should check for these capabilities before committing:
Connectors and integration depth. The system must connect to your actual data sources, not just popular ones. Evaluate the connector library against your stack: ERP, CRM, databases, cloud storage, marketing APIs. For legacy systems without native APIs, middleware or RPA-style connectors are often required.
Transformation layer. A scheduling tool that moves raw data without transforming it is not a reporting system. Look for a built-in modeling layer or confirmed compatibility with tools like dbt or custom SQL transformations.
Scheduling and real-time refresh. Confirm the system supports both scheduled batch runs and event-triggered or near real-time refreshes, depending on your use cases.
Templating engine. Branded, formatted output matters for board packs and client reports. Verify the tool supports custom templates, not just generic chart exports.
Role-based access controls. Different stakeholders need different data. Finance should not see HR data; clients should not see internal margins. Granular access controls are non-negotiable.
Audit logs and data lineage. For compliance and debugging, you need a record of when data was pulled, what transformation ran, and who accessed what.
Security and compliance. Confirm encryption in transit and at rest, data residency options if your industry requires them (healthcare, financial services), and SOC 2 or equivalent certification for cloud-hosted tools.
Evaluating tools by frequency, number of reports, integrations required, and required customizability is the right framework. Code-first options trade higher upfront engineering effort for greater long-term flexibility; low-code platforms deploy faster but hit limits at scale.
How do you implement automated reporting? A step-by-step checklist
A phased approach reduces risk and builds organizational trust in the system before you scale.
- Audit your current reporting. List every recurring report: who builds it, which data sources it uses, how long it takes, and who receives it. Identify the two or three reports with the highest production burden or the most downstream decisions riding on them.
- Define KPIs and data ownership. Automating without agreed metric definitions often automates confusion rather than clarity. Before writing a single connector, document what each KPI means, which system is the source of truth, and who owns each data domain.
- Set success criteria. Define what “done” looks like for the pilot: report delivery time, error rate, stakeholder satisfaction, hours saved.
- Build the pilot. Select one or two high-impact reports. Build connectors, validate data against manual outputs, schedule delivery, and run parallel for two to four weeks before decommissioning the manual process.
- Validate and sign off. Have the report owner compare automated output to the manual baseline. Document discrepancies and resolve them before rollout.
- Expand and govern. Add reports incrementally. Document each pipeline, assign an owner, set a refresh SLA, and establish a process for handling failures.
- Train and communicate. Show stakeholders where to find reports, how to interpret them, and who to contact when something looks wrong. Adoption depends on trust, and trust depends on transparency.
- Monitor continuously. Set anomaly detection alerts for data freshness and metric outliers. Schedule quarterly reviews to retire stale reports and update KPI definitions.
Pilot timelines typically run four to eight weeks for a two-report scope. Enterprise rollouts covering ten or more data sources and twenty or more reports commonly take four to nine months.
What challenges should you expect, and how do you solve them?
Data quality and inconsistency. Automated pipelines surface data problems that manual processes quietly paper over. Garbage in, garbage out applies at scale. Solution: Run a data quality audit before building pipelines. Add validation rules that flag anomalies rather than silently passing bad data downstream.
Disconnected legacy systems. Many ERP and on-premise systems lack modern APIs. Solution: Budget for middleware or RPA-style connectors. This is the most common source of timeline overruns; account for it explicitly in scoping.
Unclear KPI definitions. If marketing and finance calculate “revenue” differently, the automated report will be wrong by design. Solution: Resolve definition conflicts before automation. A KPI registry, even a simple shared document, prevents this.
User resistance. Teams that own local spreadsheets often resist centralized reporting because it removes their control over the numbers. Solution: Involve key stakeholders in the pilot design. When people help define the report, they trust the output.
Pro Tip: Gate your pilot on data validation, not on schedule. A report that goes live two weeks late but matches the manual baseline builds more trust than one that ships on time with a 3% discrepancy. That trust is what gets the next ten reports approved.
What does implementation cost, and when do you see ROI?
Cost and timeline vary significantly by scope, but the table below reflects typical ranges for US-based implementations.
| Scope | Pilot (1–3 reports) | Mid-scale (5–15 reports) | Enterprise (20+ reports) |
|---|---|---|---|
| Timeline | 4–8 weeks | 3–5 months | 6 months |
| Key cost drivers | Connector build, data validation, template design | ETL complexity, BI licensing, training | Custom middleware, governance, change management |
| Expected time savings | 40–70% of report production time; process costs fall 35–46% | Compounds across teams | Organization-wide |
The main cost drivers are connector complexity (legacy systems cost more to integrate), data transformation effort (the messier the source data, the more engineering time), BI platform licensing, and change management. Organizations that underestimate the last item consistently overspend on the others.
ROI timelines depend on baseline production costs. A team spending 15 analyst-hours per week on manual reporting, at a fully loaded cost of $75/hour, spends roughly $58,500 per year on report production alone. A 50% reduction pays for a mid-scale implementation in under a year. For AI-driven approaches to reducing operational costs, the compounding effect across multiple workflows accelerates that payback further.
How do you keep automated reports accurate over time?
Governance is what separates a reporting system that stays reliable from one that quietly drifts. The operational practices that matter most:
- Assign a named owner to every pipeline. When a report breaks, someone must be accountable for fixing it within a defined SLA.
- Maintain a KPI definitions registry. As the business evolves, metric definitions change. Version-control the definitions and update pipelines when they do.
- Set data freshness alerts. If a pipeline fails silently, stakeholders may consume stale data without knowing it. Alerts on last-refresh timestamps catch this before it causes decisions.
- Run anomaly detection. Flag metric values that fall outside historical ranges. A sudden 90% drop in reported revenue is more likely a pipeline failure than a business event.
- Schedule quarterly dashboard reviews. Remove reports no one opens. Update KPIs that no longer reflect current strategy. A reporting environment that grows without pruning becomes as unmanageable as the spreadsheet chaos it replaced.
- Document every pipeline. Source system, transformation logic, refresh schedule, owner, and downstream consumers. This documentation is what allows a new team member to maintain the system without tribal knowledge.
- Enforce role-based access reviews semi-annually. People change roles; access permissions rarely update automatically. A formal review prevents data exposure and keeps compliance audits clean.
What does the evidence say about automated reporting’s impact?
The benchmarks are consistent across sources. Enterprise and finance implementations reduce report production time by 40–70% and cut process costs by 35–46%. Large manual reporting workloads can total tens of thousands of avoidable hours annually, and the cost reduction potential when automation is paired with process improvement reaches roughly 46%.
RPA and digital worker implementations in legacy environments show even sharper gains in specific contexts: one documented case ran report generation 15 times faster than the manual equivalent, a result that is typical when the baseline involves navigating complex ERP interfaces by hand.
The qualitative shift matters as much as the efficiency numbers. The organizations that get the most from automated reporting are not the ones that cut the most analyst hours. They are the ones that redirect those hours toward interpretation, scenario modeling, and early intervention. Near real-time dashboards change the cadence of decision-making: a CFO who sees a margin compression signal on day four of a month can act before it becomes a quarter-end problem.
Building a data-driven culture requires more than technology. The MIT Sloan Management Review identifies trust in data, shared definitions, and leadership modeling as the elements that determine whether analytics investments translate into better decisions. Automated reporting creates the infrastructure; governance and culture determine whether it gets used.
Key Takeaways
Automated reporting reduces production time by 40–70% and process costs by 35–46%, but the lasting value comes from redirecting analyst time toward decisions rather than data assembly.
| Point | Details |
|---|---|
| Core definition | Automated reporting connects source systems, transforms data, and distributes reports without manual intervention. |
| Efficiency benchmarks | Production time drops 40–70%; process costs fall 35–46% in enterprise and finance implementations. |
| Implementation sequence | Audit first, define KPIs before building, pilot on 1–2 reports, validate against manual baseline before scaling. |
| Governance is non-negotiable | Assign pipeline owners, maintain a KPI registry, and set data freshness alerts to keep reports accurate over time. |
| Botiqueai’s role | Botiqueai builds custom connectors, ETL pipelines, and automated workflows using n8n and Make for teams ready to move from audit to pilot. |
The part most teams get wrong about automation
The conventional framing of automated reporting as an efficiency play is accurate but incomplete. Teams that approach it purely as “let’s save analyst hours” tend to automate their existing reports and stop there. They get the time savings. They miss the bigger shift.
The more interesting outcome is what happens to decision quality when leadership stops spending meeting time on “which number is right.” That argument, the one where finance has one figure and operations has another, is a symptom of a governance problem, not a data problem. Automation forces the governance conversation because you cannot build a pipeline without deciding which system is the source of truth. That decision, made once and documented, is worth more than any dashboard.
The teams that get the most from automated reporting are the ones that treat the implementation as an opportunity to clean up their metric definitions, not just their processes. The technology is the easy part. Agreeing on what “gross margin” means across three departments is the hard part, and it is the part that determines whether the automated report is trusted or ignored.
One practical implication: sequence your pilot around a report where the definition dispute is already resolved. Pick the report everyone agrees on, automate it cleanly, and let that success build the organizational trust you will need when you get to the contested metrics. Trying to resolve a three-year argument about revenue attribution while simultaneously building a pipeline is a reliable way to stall both efforts.
For SMBs automating repetitive operational tasks, the same principle applies: start with the report that has one owner, one source, and one clear audience. Scale from there.
Botiqueai builds the pipelines so your team can focus on the decisions
Most teams know which reports they want to automate. The friction is in the connector work: mapping legacy system outputs, building transformation logic, and wiring up distribution so the right person gets the right report at the right time.
Botiqueai builds custom automation workflows using n8n and Make, including data connectors, ETL pipelines, scheduled report delivery, and threshold alerts, tailored to your existing stack. A typical pilot covers two to three high-impact reports, runs four to six weeks, and delivers a validated, production-ready pipeline with documented logic and assigned ownership. No generic templates, no off-the-shelf dashboards that almost fit.
If your team is past the “should we automate?” question and ready to scope a pilot, request a workflow automation consultation and get a scoped proposal within a week.
Useful sources
- How to Automate Your Business’s Reporting Workflows — HubSpot: Covers tool categories (CRM reporting, BI platforms, connectors), weekly hours saved, and the importance of KPI definitions before automation. Useful for marketing and sales teams.
- Manual Reporting vs. Automated Reporting Tools — Lab Manager: Detailed comparison of accuracy, auditability, and error risk between manual and automated approaches, with context for regulated environments.
- Building a Data-Driven Culture: Four Key Elements — MIT Sloan Management Review: Authoritative perspective on the organizational and cultural factors that determine whether analytics investments translate into better decisions.