Cut Downtime 30–50% With Predictive Maintenance for Manufacturers
Cut Downtime 30–50% With Predictive Maintenance for Manufacturers
Predictive maintenance uses continuous condition monitoring and analytics to catch equipment failures before they happen, replacing fixed maintenance schedules with data-driven decisions. The core payoff is fewer unplanned shutdowns and lower maintenance spend, since technicians fix what’s actually degrading instead of servicing machines that don’t need it yet. This guide walks through the sensors, the algorithms, the rollout sequence, and the ROI math, plus how Botiqueai approaches these projects in practice.
TL;DR:
- Starting with a small, well-scoped pilot on high-impact assets and using transfer learning accelerates ROI and builds confidence for full deployment.
- Combining local edge analysis with cloud processing provides the quickest alerts while enabling fleet-wide model training and refinement.
- Using a tiered alert system with confidence scoring helps maintain operator trust and reduces alert fatigue, increasing system effectiveness.
- Data quality and proper sensor mounting are critical for reliable detection, especially when deploying low-cost MEMS sensors in smaller operations.
- Successful integration with existing maintenance, ERP, or GMAO systems transforms anomalies into actionable work orders, making predictive maintenance operationally valuable.
Table of Contents
- What Is Predictive Maintenance and How Does It Work?
- Which Sensors and Signatures Detect Equipment Failures?
- How Much ROI Does Predictive Maintenance Actually Deliver?
- How Do You Roll Out a Predictive Maintenance Program?
- What Goes Wrong With Predictive Maintenance Projects?
- Where Does Predictive Maintenance Deliver the Biggest Wins?
- Why Botiqueai’s Approach to Predictive Maintenance Programs Works
- Data Storage Practices That Keep Predictive Maintenance Models Reliable
- How Often Should Predictive Maintenance Models Get Retrained?
- How Do You Get Maintenance Teams to Trust Predictive Alerts?
- What Does a Predictive Maintenance Project Actually Cost?
- The Honest Take on What Makes Predictive Maintenance Programs Succeed
- Get Predictive Maintenance Built Around Your Existing Systems
- Sources
What Is Predictive Maintenance and How Does It Work?
Predictive maintenance (PdM) differs from the two older maintenance models in one key way: timing. Corrective maintenance fixes things after they break. Preventive maintenance replaces parts on a fixed calendar, whether they need it or not. Predictive maintenance watches the actual condition of the equipment and intervenes only when data shows a real problem developing.
That shift from calendar-based to condition-based servicing is what IBM’s research on AI in predictive maintenance points to as the biggest efficiency gain: fewer parts get swapped out prematurely, and failures get caught earlier because the system is watching continuously rather than checking on a schedule.
The mechanics run as a four-step loop:
- Collect — sensors capture vibration, temperature, current draw, sound, or oil chemistry from the asset in near real time.
- Transmit and store — data moves from the sensor to an edge gateway or cloud database, often after basic filtering to cut noise.
- Analyze — algorithms compare the incoming signal against thresholds or learned baselines to flag anomalies or estimate remaining useful life (RUL).
- Act — a flagged anomaly triggers a work order, ideally pushed automatically into the maintenance management system rather than emailed to someone who might miss it.
Where that analysis happens matters more than most teams assume going in. Edge processing, meaning the analysis runs on a local gateway near the machine, cuts latency and keeps raw data off congested networks, which matters for high-frequency vibration data sampled thousands of times per second. Cloud processing centralizes storage and makes it easier to train models across a whole fleet of similar assets, but it depends on stable connectivity and adds a few seconds to a few minutes of lag. Most industrial deployments end up doing both: edge for immediate alarm thresholds, cloud for the deeper pattern recognition and fleet-wide model training.
Which Sensors and Signatures Detect Equipment Failures?
Different failure modes leave different fingerprints, and matching the right sensor to the right fingerprint is where most of the engineering judgment in a predictive maintenance program actually lives.
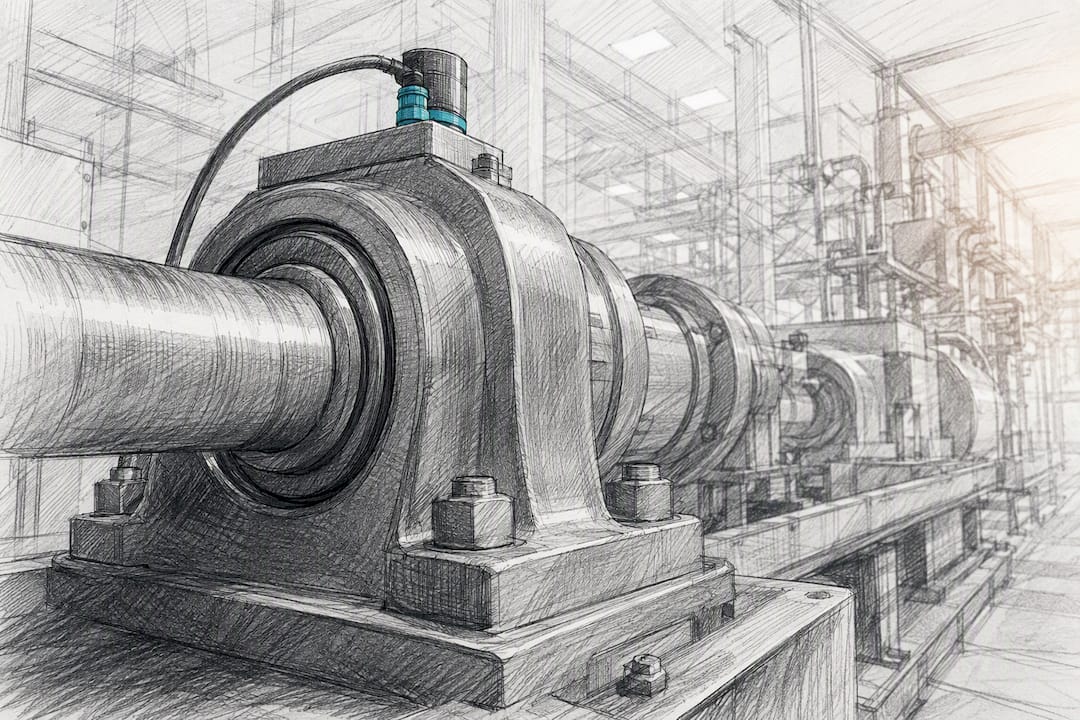
Vibration analysis, typically processed through a Fast Fourier Transform (FFT), is the workhorse for rotating equipment. Bearings and gearboxes generate distinct frequency peaks as they wear, often detectable weeks before a bearing seizes. Motor Current Signature Analysis (MCSA) reads electrical current patterns to catch rotor bar cracks, winding faults, and eccentricity problems without ever touching the motor housing. Thermal imaging flags lubrication breakdown and overheating in gearboxes, electrical panels, and bearings, often the cheapest sensor to deploy since a single camera can scan dozens of assets. Acoustic and ultrasound sensors pick up high-frequency emissions from early-stage friction and micro-cracking, frequently the earliest warning signal available, before vibration signatures even shift. Oil analysis tracks particle counts and chemical breakdown in lubricants, which is the standard for gearboxes, hydraulics, and large diesel engines.

On the hardware side, MEMS sensors are cheap and easy to deploy at scale but sample at lower rates, fine for slow-changing signals like temperature. ICP/IEPE accelerometers cost more but capture the high-frequency detail vibration analysis needs, generally sampled in the kilohertz range on critical rotating assets. Mounting matters as much as the sensor spec: a poorly torqued accelerometer can distort the very signature you’re trying to read.
On the analysis side, most mature programs run a hybrid. Static thresholds following ISO 10816/20816 vibration severity bands catch the obvious cases. Unsupervised anomaly detection flags deviations from a machine’s own historical baseline without needing labeled failure examples. Supervised classification and RUL models, often built with XGBoost or LSTM architectures, predict how much life is left once a fault is confirmed. Because these models can be opaque, a growing body of research pushes explainability methods like LIME, SHAP, and SegSHAP so operators get a reason for an alert, not just a number.
Pro Tip: Start with unsupervised anomaly detection on your critical assets before investing in supervised RUL models. You’ll get useful alerts immediately, and the anomaly history becomes your training data for the more advanced models later.
How Much ROI Does Predictive Maintenance Actually Deliver?
The KPIs that matter here are the ones your finance team already tracks: unplanned downtime hours, Mean Time Between Failures (MTBF), Mean Time To Repair (MTTR), total maintenance spend, spare parts consumption, and production yield. Predictive maintenance moves all six, but not evenly, and downtime is usually where the biggest number shows up first.
Measured case sets compiled by TeepTrak’s industrial predictive maintenance data show unplanned downtime dropping 30 to 50 percent and total maintenance cost falling 15 to 35 percent, with payback typically landing in the 12 to 18 month range. Those figures assume a reasonably disciplined pilot on assets that already fail often enough to generate a meaningful data history. Younger equipment with few historical failures takes longer to show a return simply because the models have less to learn from.
Building your own business case comes down to three inputs:
- Baseline cost of unplanned downtime — hourly production loss multiplied by average annual unplanned hours on the target asset.
- Current maintenance spend on that asset — labor, parts, and any premium paid for emergency repairs versus scheduled ones.
- Program cost — sensors, integration work, and any subscription fees for the analytics platform, spread across the expected payback window.
A conservative model applies the lower end of the published reduction ranges to your baseline. If a stamping line loses $40,000 a year to unplanned stoppages and a pilot program costs $25,000 to instrument and run, even a 30 percent downtime cut pays the program back inside a year. Run that math per asset, not per plant. A single high-value bottleneck machine often justifies the whole pilot on its own.
How Do You Roll Out a Predictive Maintenance Program?
Rolling out predictive maintenance well is less about the algorithm and more about sequencing. Skip a step here and the project stalls at the pilot stage, which is exactly what happens to a lot of ambitious PdM rollouts.
1. Prioritize assets with a criticality matrix. Score each machine on failure impact (safety, production loss, repair cost) against failure probability and sensor accessibility. Start with assets that score high on impact and are physically easy to instrument. A hard-to-reach gearbox buried in a wall might be your most critical asset and still the wrong pilot choice.
2. Design a tight pilot. A useful pilot covers three to eight assets, runs long enough to capture at least one seasonal cycle if the equipment’s load varies, and defines success criteria before day one: a target detection lead time, a false-positive ceiling, and a clear go/no-go date. TeepTrak’s analysis of successful programs notes that the projects that scale are almost always the ones that started narrow, not the ones that tried enterprise-wide rollout from day one.
3. Build the data pipeline before the model. Feature engineering for time-series sensor data (rolling averages, spectral features, statistical moments) matters more to model performance than picking a fancier algorithm. Industry analysis of data quality in Industry 4.0 maintenance consistently finds that clean, well-labeled data outperforms complex models trained on noisy inputs.
4. Use transfer learning where local failure data is thin. Public datasets like NASA’s CMAPSS or the FEMTO and CWRU bearing datasets let you pretrain a model, then fine-tune it on as few as three to five local failure examples rather than waiting months to accumulate your own failure history.
5. Monitor for model drift. Sensor drift, seasonal load changes, and equipment modifications all degrade model accuracy over time, so build a retraining trigger into the plan from the start, not as an afterthought once accuracy drops.
6. Integrate with GMAO/ERP systems, not around them. The real operational value shows up when a flagged anomaly automatically creates a work order in your maintenance management system through an API or webhook, closing the loop without a human relaying the alert by email. That integration point is where most PdM projects actually realize value, and where the ones that stall usually fall short.
A realistic timeline runs 12 to 18 months from initial pilot to a scaled, multi-asset deployment, assuming the pilot hits its success criteria within the first three to six months.
What Goes Wrong With Predictive Maintenance Projects?
Most PdM failures trace back to a handful of predictable problems, and every one of them has a known fix.
- Thin or noisy data. New equipment rarely has enough labeled failure history to train a reliable model. Transfer learning from public datasets, combined with a handful of local examples, gives you a usable warm start instead of a multi-year data collection wait.
- Alert fatigue. A system that cries wolf gets ignored within weeks. Confidence scoring and tiered alerts, where low-confidence anomalies go to a dashboard and high-confidence ones trigger a work order, keep operators trusting the system instead of muting it.
- Threshold decisioning under uncertainty. Setting alarm thresholds too tight produces false positives; too loose and you miss real faults. Techniques de l’Ingénieur’s methodology on decision theory for probabilistic failure characterization gives a rigorous way to balance that trade-off instead of guessing.
- Organizational resistance. Maintenance teams who’ve never worked with predictive alerts often distrust them. A cross-functional RACI chart, clear KPIs, and hands-on training close that gap faster than any dashboard feature.
- Cybersecurity gaps. IoT sensors on the plant floor are network endpoints, and each one is a potential entry point. Segmented networks and firmware update discipline aren’t optional extras on a PdM rollout.
Pro Tip: Route every anomaly alert through a two-tier system: a low-confidence tier that logs to a dashboard for review, and a high-confidence tier that opens a work order automatically. This one change does more for operator trust than any model accuracy improvement.
Where Does Predictive Maintenance Deliver the Biggest Wins?
Different industries lean on different sensor combinations, and the expected detection lead time shifts depending on what’s being watched.
- Manufacturing: Vibration analysis on bearings and conveyor systems, often processed at the edge with local FFT computation, catches bearing degradation weeks ahead of failure on continuously running lines.
- Energy and utilities: Pumps and turbines combine vibration, thermal imaging, and oil analysis, since these assets run around the clock and unplanned outages carry a steep cost per hour.
- Transport: Rolling stock uses MCSA for motor faults alongside accelerometers and acoustic sensors, monitoring assets that are harder to pull offline for scheduled inspection.
- Buildings and HVAC: Ultrasonic leak detection and thermal monitoring catch compressor and refrigerant issues before they become full system failures.
Smaller manufacturers shouldn’t assume this is out of reach financially. Practical field data shows affordable MEMS sensors paired with open-source machine learning can detect bearing faults weeks in advance when the sensors are properly mounted and the model is scoped tightly, no enterprise budget required.
Why Botiqueai’s Approach to Predictive Maintenance Programs Works
Certain AI and automation providers build custom systems for industrial and operational clients, applying a disciplined approach to predictive maintenance projects that involves starting narrow, proving value on a handful of assets, then scaling. The practical playbook favors quick-win pilot templates on a few critical machines, transfer learning to bootstrap models when local failure data is scarce, and flexible edge or cloud deployment depending on latency needs. That approach mirrors what we’ve delivered in enterprise AI implementations like our work with AXA, where integration with existing systems mattered as much as the model itself.
Data Storage Practices That Keep Predictive Maintenance Models Reliable
Sensor data volume adds up fast. A single vibration sensor sampling at a few kilohertz generates gigabytes per month, and a fleet of dozens of sensors multiplies that quickly. Storage strategy needs to separate raw signal data from processed features, because keeping every raw waveform indefinitely is expensive and mostly unnecessary once the relevant features are extracted.
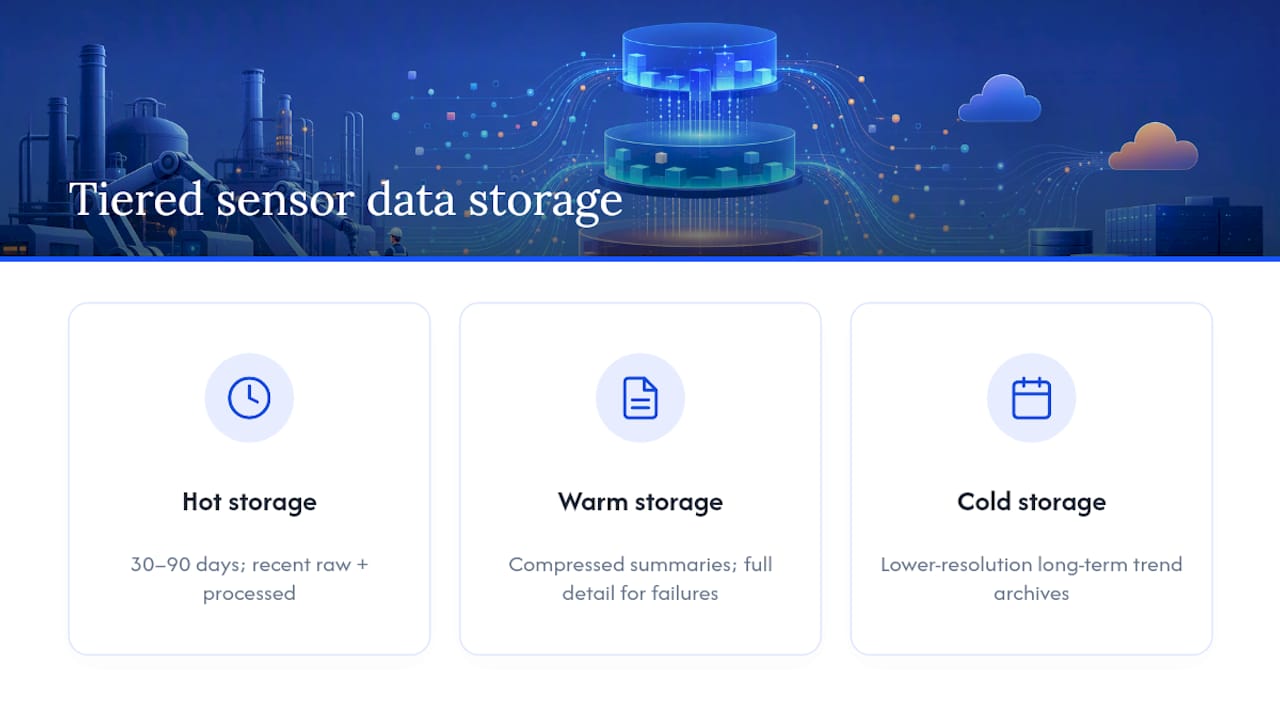
A tiered approach works well in practice. Hot storage holds recent raw and processed data, roughly the last 30 to 90 days, for immediate model access and troubleshooting. Warm storage compresses older raw signals into summary statistics while retaining full detail on any period tied to a confirmed failure event, since those windows become training data for future models. Cold storage archives long-term trend data at a lower resolution for regulatory or long-horizon analysis.
Time-series databases purpose-built for sensor data, rather than general-purpose relational databases, handle the write volume and query patterns of continuous monitoring far better. Tagging every stored record with asset ID, sensor location, and maintenance event history matters just as much as the raw signal itself. Without that metadata, a model retrain six months later has no way to line up a sensor reading with what actually happened to the machine.
Data governance also needs a clear retention policy from day one. Regulatory requirements vary by sector, but even without a compliance mandate, deciding upfront what gets kept at full resolution versus summarized saves a lot of storage cost and confusion later.
How Often Should Predictive Maintenance Models Get Retrained?
Models degrade quietly. A model trained on six months of pump vibration data will drift as bearings age, seasons change load patterns, or a maintenance team swaps in a different part supplier. None of that shows up as an obvious error; it shows up as slowly rising false positives or, worse, missed detections.
Continuous improvement in a predictive maintenance program means building retraining into the operating rhythm, not treating the first model as final. A practical cadence checks model performance against actual maintenance outcomes quarterly at minimum, comparing predicted anomalies against what technicians actually found on inspection. When accuracy drifts past an agreed threshold, retraining runs automatically rather than waiting for someone to notice a decline.
Every confirmed failure and every false alarm is training data. Feeding operator feedback, meaning a technician confirming or rejecting an alert, back into the model closes a loop that steadily improves precision over the life of the program. This is also where explainability tools like SHAP earn their keep: when a model’s reasoning is visible, engineers can spot exactly which feature is driving a drift and correct it, instead of retraining blind and hoping the new version performs better.
Version control matters here just as much as it does in software. Keep prior model versions accessible and log which version produced which alert, so a bad retrain can be rolled back without losing the ability to explain historical decisions to an auditor or a skeptical operations manager.
How Do You Get Maintenance Teams to Trust Predictive Alerts?
The technology rarely kills a predictive maintenance program. The people do, and usually not out of malice, just out of habit and understandable skepticism toward a system that just told them to inspect a machine that looks and sounds fine.
Change management starts with involving maintenance technicians in the pilot design, not just informing them once the system goes live. Technicians who help set the alert thresholds and who see their own inspection findings feed back into the model tend to trust it faster than teams who have a dashboard dropped on their desk with no context.
Training needs two distinct tracks. Technicians need to understand what an alert means physically, which sensor triggered it, and what to check first, not the statistics behind the model. Managers and planners need the KPI side, how to read a fleet health dashboard and prioritize which alerts get a technician dispatched today versus this week.
A clear RACI structure, defining who owns sensor maintenance, who reviews model alerts, who approves work orders, and who owns the retraining cadence, prevents the common failure mode where everyone assumes someone else is watching the dashboard. Explainability features that show why a model flagged an anomaly, rather than a bare severity score, consistently speed up this trust-building process, since operators need understandable reasoning before they’ll change established maintenance behavior.
What Does a Predictive Maintenance Project Actually Cost?
Budgeting for predictive maintenance breaks into four categories, and skipping any one of them is how pilots run over budget.
Sensor hardware is the most visible line item but often the smallest. MEMS accelerometers cost far less per unit than industrial ICP/IEPE sensors, and a pilot on five assets rarely needs more than a modest hardware spend. Integration work, connecting sensors to a gateway, building the data pipeline, and linking outputs into your GMAO or ERP system, usually costs more than the sensors themselves, since it involves custom engineering rather than off-the-shelf parts.
Software and analytics platforms range from subscription-based monitoring services to custom-built model pipelines, and the right choice depends on how many asset types you need to cover and whether your team has in-house data science capacity. Ongoing costs include model retraining, sensor maintenance, and the labor to review alerts, expenses that don’t disappear after the pilot phase and need a place in the annual maintenance budget, not just the initial capital request.
A conservative budgeting approach scopes the pilot first, five assets, a defined duration, explicit success criteria, then prices the scaled rollout only after the pilot proves the reduction numbers on your specific equipment. That sequencing keeps the initial ask small enough to approve quickly while building the internal case for the larger investment.
The Honest Take on What Makes Predictive Maintenance Programs Succeed
The conventional pitch on predictive maintenance oversells the algorithm and undersells the plumbing. Vendors talk about RUL models and neural networks; the projects that actually deliver the published 30 to 50 percent downtime reductions succeed because someone got the data pipeline and the GMAO integration right, not because they picked a fancier model.
The industry’s own case data backs this up: the pilots that scale are consistently the narrow, well-scoped ones on three to eight assets, not the ambitious enterprise-wide rollouts. That’s a hard truth for anyone under pressure to show fleet-wide impact fast. Start small, prove the reduction on your worst-performing asset, and let that result build the case for scale.
Explainability deserves more attention than it gets in most PdM conversations. A model that flags an anomaly without a reason attached will get ignored by technicians who’ve seen false alarms before. The technical rigor matters, but only insofar as it earns operator trust. Prioritize the integration and the human buy-in first. The model accuracy will keep improving after that, almost as a side effect.
— Botiqueai
Get Predictive Maintenance Built Around Your Existing Systems
Most predictive maintenance rollouts stall not because the sensors fail, but because nobody connected the alert to a system your team already uses. Some providers build custom automation and AI agents that plug directly into GMAO, ERP, or workflow tools, so a flagged anomaly turns into a work order automatically instead of sitting in someone’s inbox.
For manufacturers and industrial teams weighing a pilot, that integration work is usually the hardest part to do well, and it’s the part off-the-shelf monitoring platforms tend to leave to you. Pilots are scoped around specific assets and existing software stacks rather than asking users to adapt to a fixed platform. If you’re evaluating where to start, visit the Botiqueai homepage to see how a custom AI automation project gets scoped, or explore how a tailored chatbot or agent like Aria handles the operational side of customer and internal workflows while your predictive maintenance data flows into the same connected system.
Sources
- Maintenance prédictive industrie 2026 : guide complet signatures + IA | TeepTrak
- The role of AI in predictive maintenance | IBM
- Maintenance prévisionnelle-prédictive : technologies et méthodes | Techniques de l’Ingénieur
- Thesis on XAI for predictive maintenance (RUL explainability) — DOI